Silver Price Analysis: XAG/USD justifies rising wedge break as bears approach $20.00
- Silver prices remain pressured after confirming three-week-old bearish chart pattern.
- MACD, RSI conditions join recent pullback from 50-SMA to keep sellers hopeful.
- 200-SMA can offer intermediate support during theoretical slump towards sub-$18.00 area.
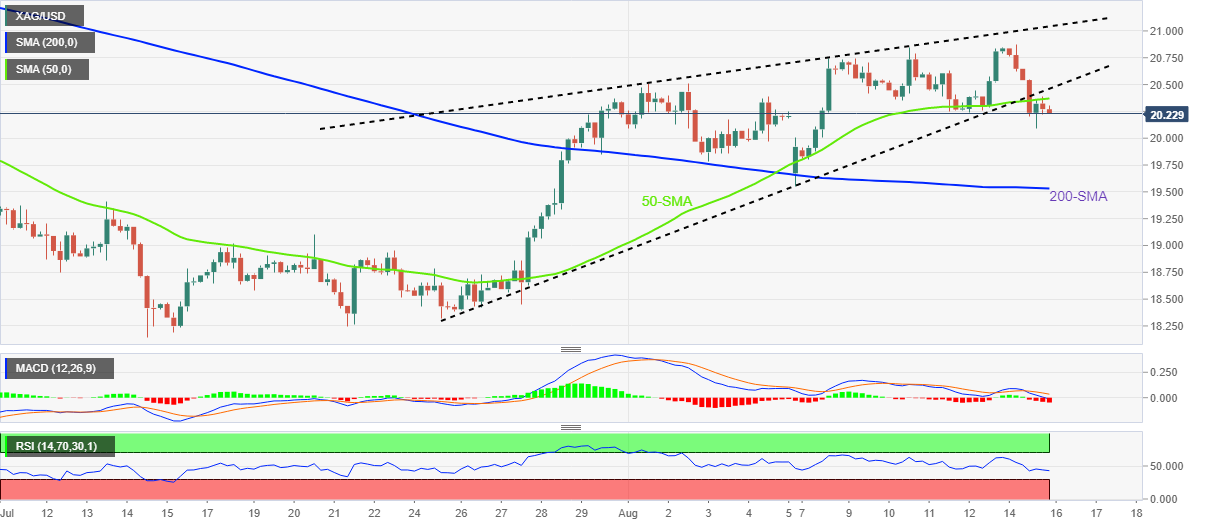
Silver price (XAG/USD) holds lower ground near $20.20 after confirming a bearish formation, namely a rising wedge, the previous day. That said, the bright metal’s pullback from the 50-SMA and the downbeat oscillators also favor the sellers during Tuesday’s Asian session.
It should, however, be noted that the $20.00 threshold and the 200-SMA around $19.50 could restrict the short-term downside of the commodity prices.
Following that, multiple levels near $19.00 and the yearly low marked in July around $18.15 might test the XAG/USD bears before highlighting the theoretical target surrounding $17.80.
Meanwhile, the 50-SMA level around $20.40 challenges the quote’s corrective pullback ahead of the stated wedge’s lower line, close to $20.50 at the latest.
Even if the silver buyers manage to cross the $20.50 hurdle an upward sloping trend line from August 01, forming part of the wedge, can challenge the metal’s further advances near the $21.00 Threshold.
Overall, silver’s confirmation of rising wedge joins downbeat MACD and RSI to suggest the metal’s further downside.
Silver: Four-hour chart
Trend: Further weakness expected