WTI Price Analysis: Sellers in the driving seat around $93.00
- WTI remains pressured at a fortnight low after breaking monthly symmetrical triangle.
- Bearish MACD signals add strength to the downside bias directing prices towards 61.8% FE.
- Recovery remains elusive unless crossing 200-SMA, $95.75 guards immediate upside.
WTI crude oil prices remain depressed after breaking the one-month-old symmetrical triangle to the south. That said, the black gold holds lower ground near $93.00, the lowest levels in two weeks, during Tuesday’s Asian session.
Given the bearish MACD signals joining the triangle’s breakdown, the commodity prices are likely to decline further.
In doing so, the $90.00 threshold may act as immediate support ahead of directing the quote towards July’s low of $88.34.
It’s worth noting, however, that the RSI (14) is nearly oversold and hence any further downside past the recent lows appears less likely. Even so, the energy benchmark’s weakness below $88.34 could make it vulnerable to testing the 61.8% Fibonacci Expansion (FE) of June-July moves, near $85.65.
Meanwhile, the corrective pullback could aim to challenge the triangle’s support line, around $95.65 by the press time.
Following that, the $100.00 psychological magnet may test the WTI bulls before directing them to the stated triangle’s upper line, near $100.70 at the latest. Also acting as the upside filter is the 200-SMA level surrounding $101.10.
WTI: Four-hour chart
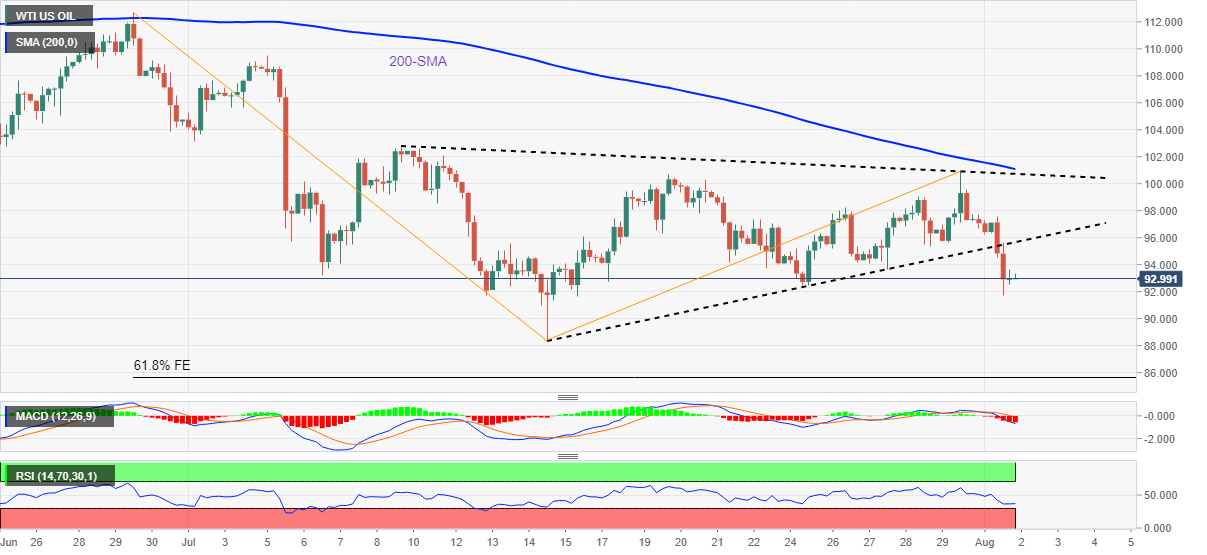
Trend: Further downside expected