WTI Price Analysis: Stays defensive around $80.00 threshold
- WTI struggles to extend bounce from weekly low, seesaws around 200-SMA.
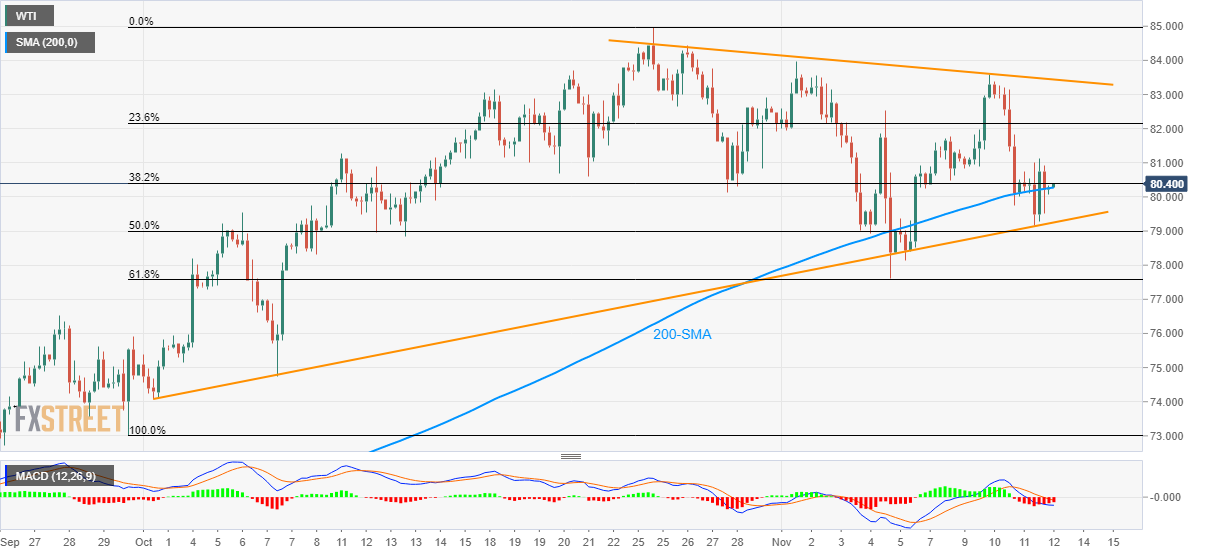
- Bearish MACD tests buyers, six-week-old support line adds to the downside filters.
WTI snaps a two-day downtrend, consolidating the weekly losses around $80.35 during early Friday. In doing so, the black gold seesaws near the 200-SMA following the bounce off an ascending support line from October 01.
However, the quote’s failure to move much beyond the key moving average and bearish MACD signals hint at the further grind between the stated support line and a three-week-old descending trend line resistance.
Inside the area between $79.25 and $83.50 key technical levels, as mentioned above, multiple levels near $82.00 and the $80.00 round figure may test the WTI bulls.
Meanwhile, a downside break of the $79.25 support line will direct the oil benchmark towards the 61.8% Fibonacci retracement (Fibo.) of September 30 to October 25 upside, near $77.60.
Following that, late September’s peak near $76.50 and the six-week low of $73.00 will gain the WTI bears’ attention.
WTI: Four-hour chart
Trend: Sideways