Silver Price Analysis: XAU/USD looks to $23.00 as RSI divergence contrasts bearish flag
- Silver takes the bids inside a bearish chart pattern, RSI, MACD favor buyers.
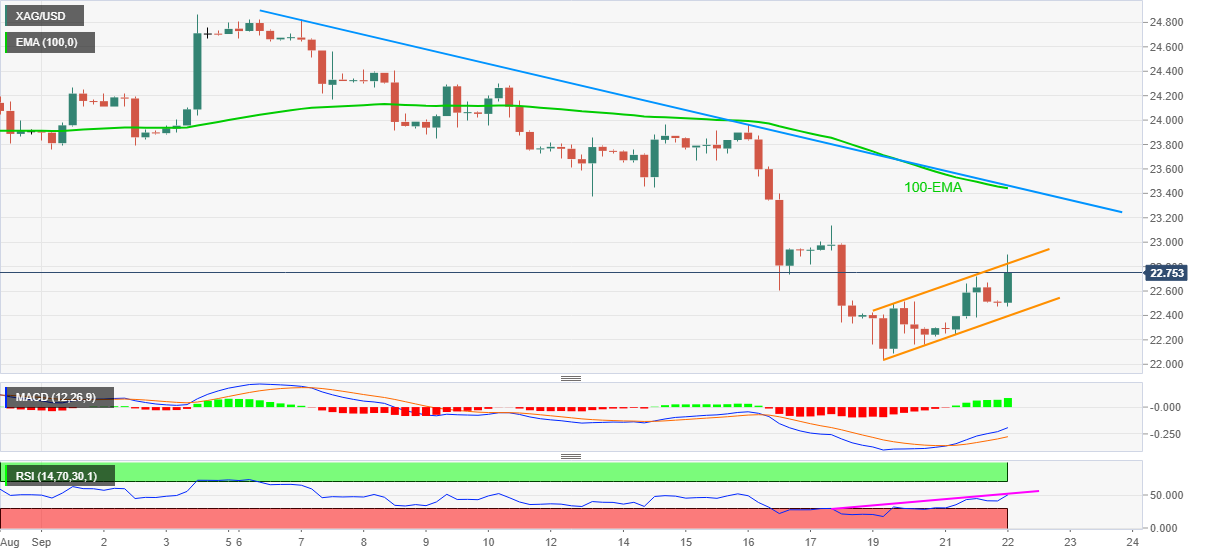
- Convergence of 100-EMA, three-week-old resistance line challenges bulls.
- Bears seek a clear break of $22.40 for fresh entries.
Silver (XAG/USD) extends the previous day’s recovery moves, up over 1.0% daily while taking bids around $22.75 during early Wednesday.
With this, the bright metal stays inside a short-term bearish flag pattern while respecting the RSI divergence and bullish MACD signals.
However, further upside needs to stay beyond $22.85 before eyeing the latest swing top near $23.13.
Also acting as the key upside filter is the confluence of 100-EMA and a descending trend line from September 07, around $23.45.
Meanwhile, a downside break of $22.40 will confirm the bearish chart pattern, theoretically suggesting a south-run towards $20.40. Though, the yearly low of $22.00 and the September 2020 bottom near $21.65 seem tough challenges for the silver sellers.
Also acting as a downside filter is the $20.00 threshold and November 2020 trough close to $21.90.
Overall, silver remains pressured towards the yearly low unless crossing $22.40.
Silver: Four-hour chart
Trend: Pullback expected