Gold Price Analysis: Recapturing $1,961 critical to recovery after sell-off – Confluence Detector
The gold sell-off continues – well after the precious metal lost the $2,000 level. As US bond yields rise, gold becomes less attractive. More importantly, traders who sent the stock all the way to a record high of $2,075 may now be taking profits to the bank. Sino-American tensions, fiscal stimulus speculation, and coronavirus figures are all eyed.
How is XAU/USD technically positioned?
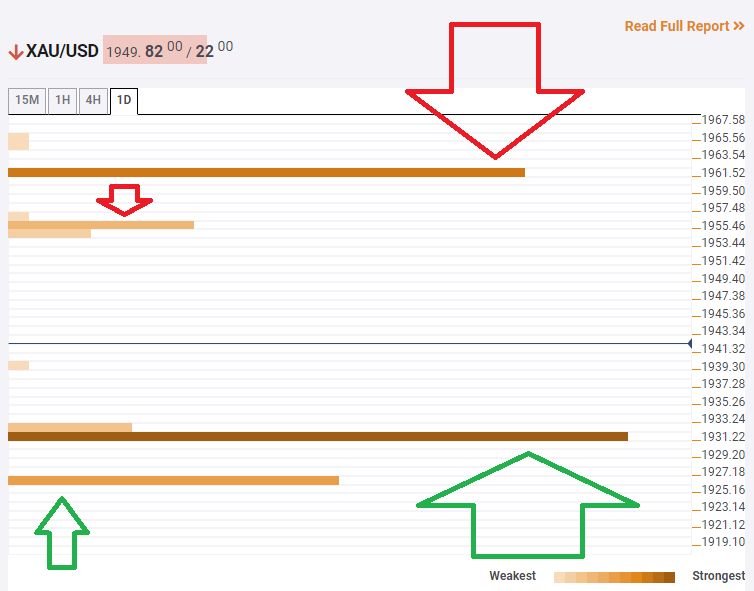
The Technical Confluences Indicator is showing that gold has significant support at $1,931, which is where the all-important Fibonacci 23.6% one-month and the previous 15-min low converge.
The next cushion is at $1,925, which is where the Bollinger Band one-day Middle hits the price.
Looking up, minor resistance awaits at $1,955, which is a confluence line including the Simple Moving Average 100-4h, the BB 15min-Lower, and the previous 1h-low.
A more significant hurdle – critical to gold's recovery – is $1,961 which is where the SMA 5-15m meets the crucial previous weekly low.
Key XAU/USD resistances and supports
Confluence Detector
The Confluence Detector finds exciting opportunities using Technical Confluences. The TC is a tool to locate and point out those price levels where there is a congestion of indicators, moving averages, Fibonacci levels, Pivot Points, etc. Knowing where these congestion points are located is very useful for the trader, and can be used as a basis for different strategies.
Learn more about Technical Confluence