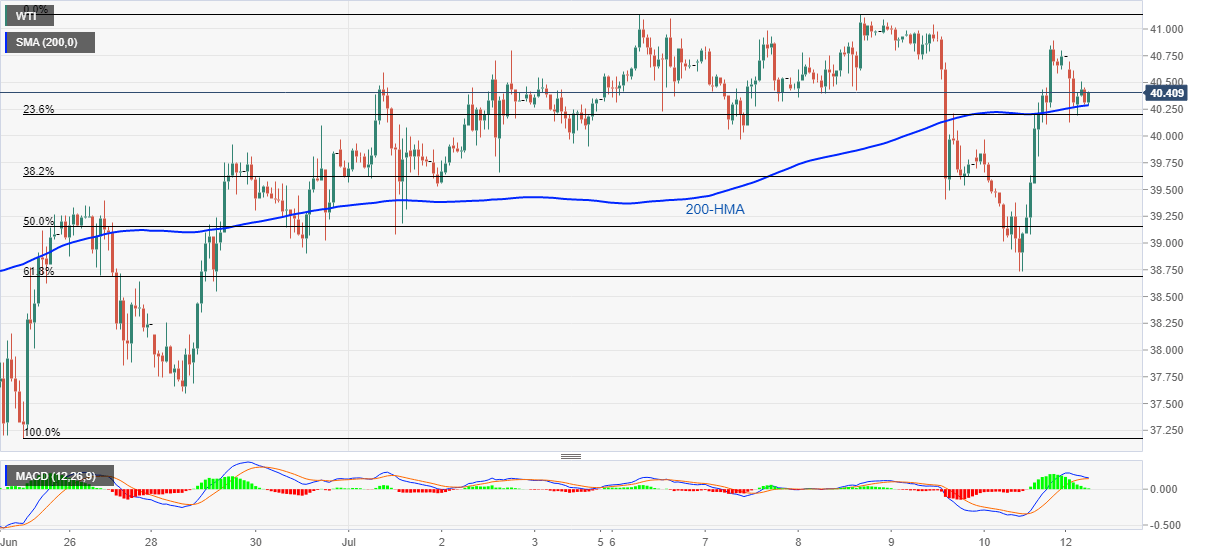
WTI Price Analysis: 200-HMA probes bears above $40.00
- WTI stays pressured beyond $40.00 despite multiple bounces off 200-HMA.
- MACD conditions suggest bears rolling up their sleeves for entry.
- Bulls will have multiple upside barriers beyond $41.00.
WTI recedes to $40.31, down 1.06% on a day, during the early Monday’s trading. The black gold extends late Friday's pullback from $40.89 but 200-HMA keeps restricting immediate downside.
Even so, repeated failures to stay strong above $40.00 joins the likely turn of MACD histogram in favor of sellers to suggest the energy benchmark’s momentum weakness. As a result, the bears are preparing for entry below 200-HMA level of $40.28 to attack $40.00.
In doing so, 61.8% Fibonacci retracement of its June 25 to July 06 upside, around 38.68, will be on their radars. Though, $39.30 and 50% Fibonacci retracement near $39.15 can offer intermediate halts during the fall.
On the upside, Friday’s top around $41.00 can act as immediate resistance ahead of the monthly peak close to $41.15.
However, the quote’s rise past-$41.00 needs validation from June month’s peak around $41.65 before eyeing February month low near $44.00.
WTI hourly chart

Trend: Pullback expected
