Back
29 Apr 2020
EUR/USD Price Analysis: Euro sidelined below 1.0900 figure ahead of FOMC
- The spot is alternating wins with losses ahead of the FOMC.
- The level to beat for sellers is the 1.0817/1.0794 support zone.
- The FOMC will reveal the Fed’s economic projections this Wednesday.
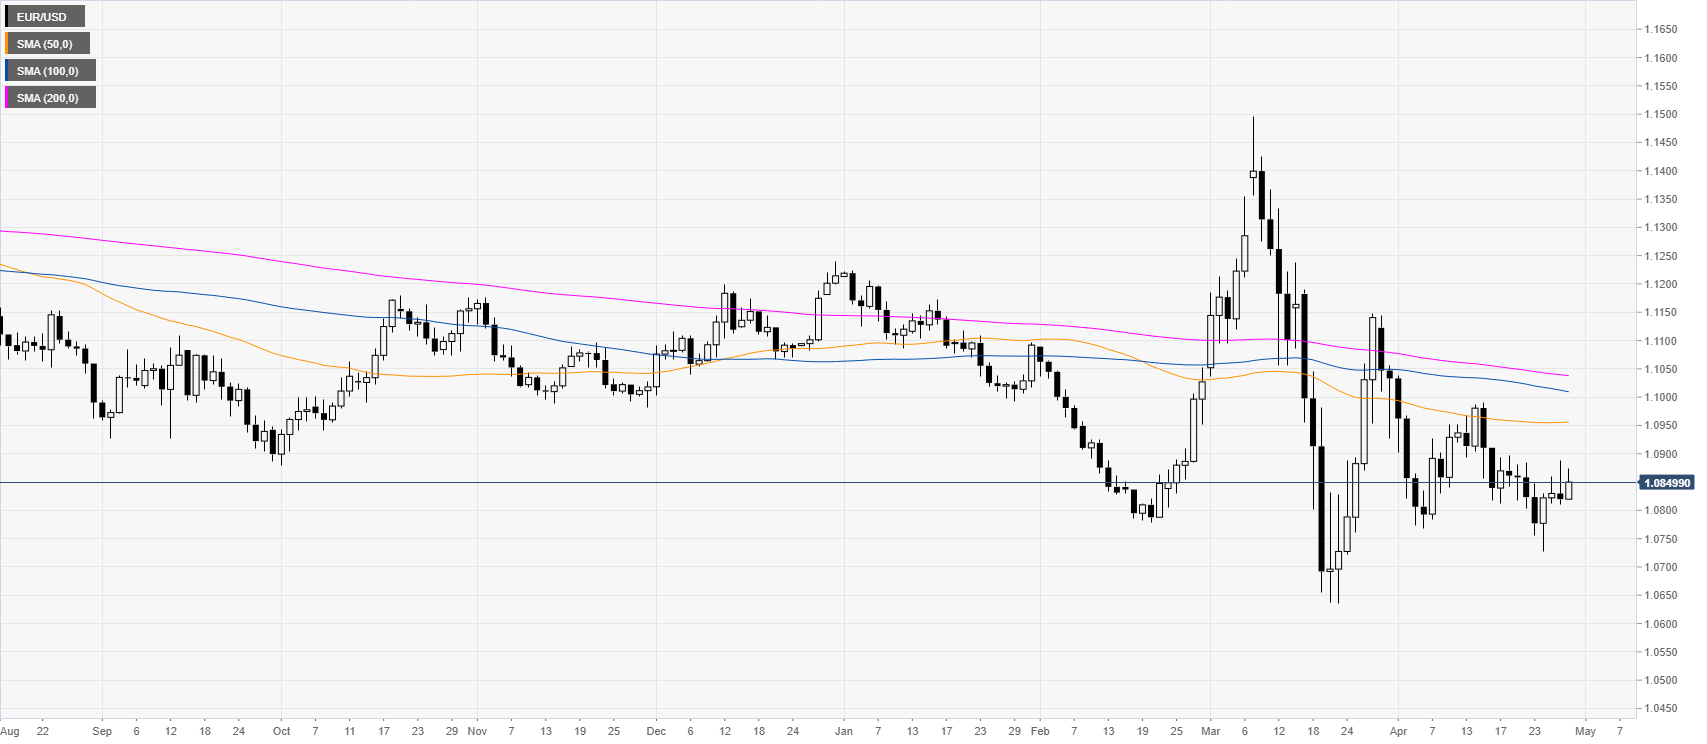
EUR/USD daily chart
EUR/USD is oscillating within familiar ranges as markets participants are waiting for the FOMC economic projections later this Wednesday.
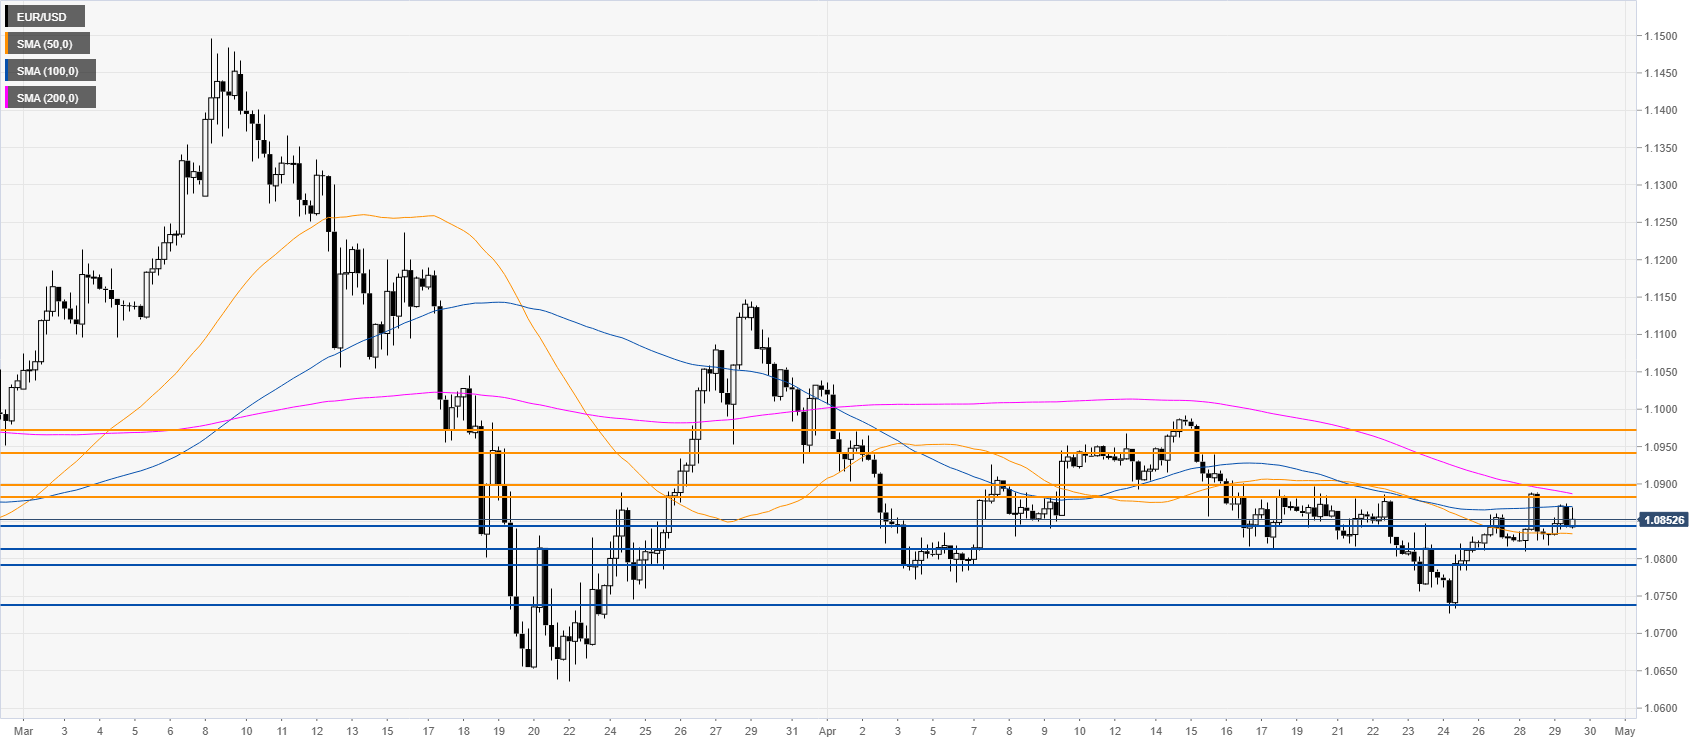
EUR/USD four-hour chart
As the FOMC is nearing the range on EUR/USD is contracting. The spot is trading below its 200 SMA on the four chart but above the 50/100 SMAs. It is worth to know that the overall picture remains bearish as sellers are looking for a break below the 1.0817/1.0794 support zone en route to the 1.0738 level near the April lows. On the flip side, the 1.0884/1.0900 resistance zone should continue to cap prices, however, if the resistance zone surpasses the market could accelerate and move towards the 1.0941 and 1.0972 price levels, according to the Technical Confluences Indicator.
Resistance: 1.0884/1.0900, 1.0941, 1.0972
Support: 1.0845, 1.0817/1.0794, 1.0738
Additional key levels