AUD/JPY Price Analysis: Bullish hammer keeps buyers hopeful
- AUD/JPY charted a bullish candlestick formation on Thursday, holds onto recovery gains afterward.
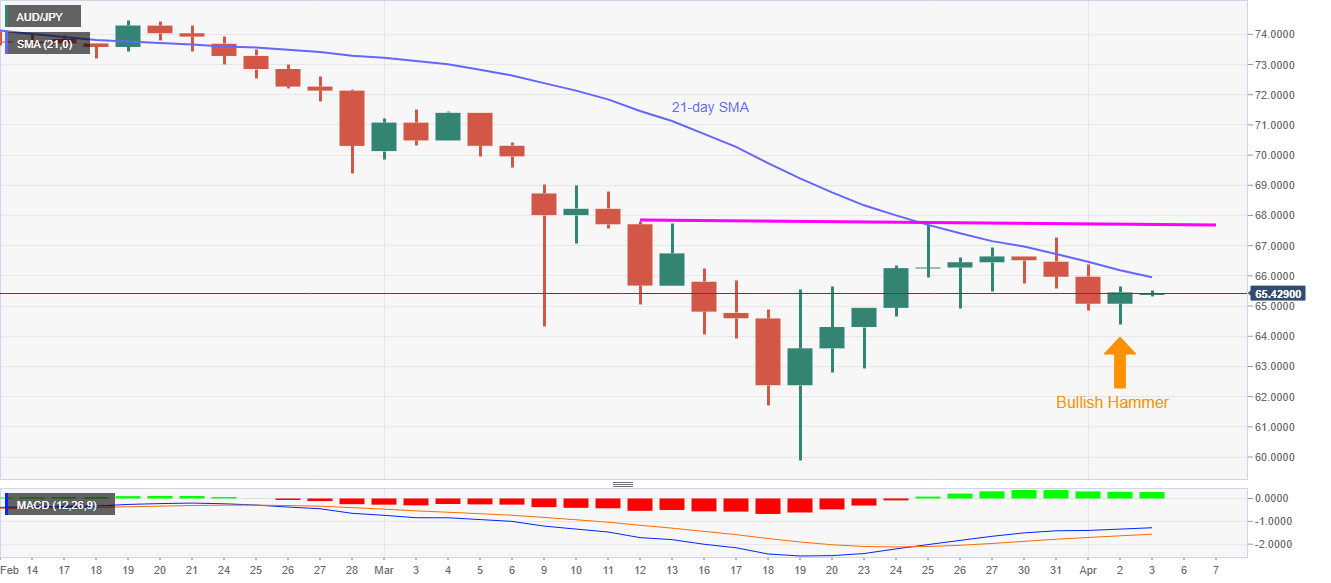
- 21-day SMA acts as the immediate upside barrier.
- A breakdown under 64.40 will defy the pattern and imply the bearish trend continuation.
AUD/JPY remains mildly bid, up 0.18% to 65.50, amid the early Asian session on Friday. That said, the pair portrayed a bullish candlestick formation, a bullish hammer, on the daily (D1) chart on Thursday.
In addition to the candlestick, MACD also flashes positive signals, which in turn pushes the pair nearer to a 21-day SMA level of 65.95.
On a clear break beyond 65.95, also crossing 66.00, the buyers can aim for Tuesday’s top surrounding 67.30 whereas 67.70/80 comprising highs marked from March 12 could lure the bulls afterward.
Meanwhile, a daily closing below Thursday’s low near 64.40 will defy the bullish candlestick formation and imply a continuation of the previous bearish trend suggesting gradual declines toward the sub-60.00 level.
Though, 63.00 and 61.70 are likely intermediate rests that can be availed during the fresh downside.
AUD/JPY daily chart
Trend: Further recovery expected