Back
10 Feb 2020
USD/INR New York Price Forecast: Greenback sidelined below the 71.60 resistance vs. rupee
- USD/INR remains vulnerable below the 72.00 figure.
- The level to beat for bears is the 71.20 support.
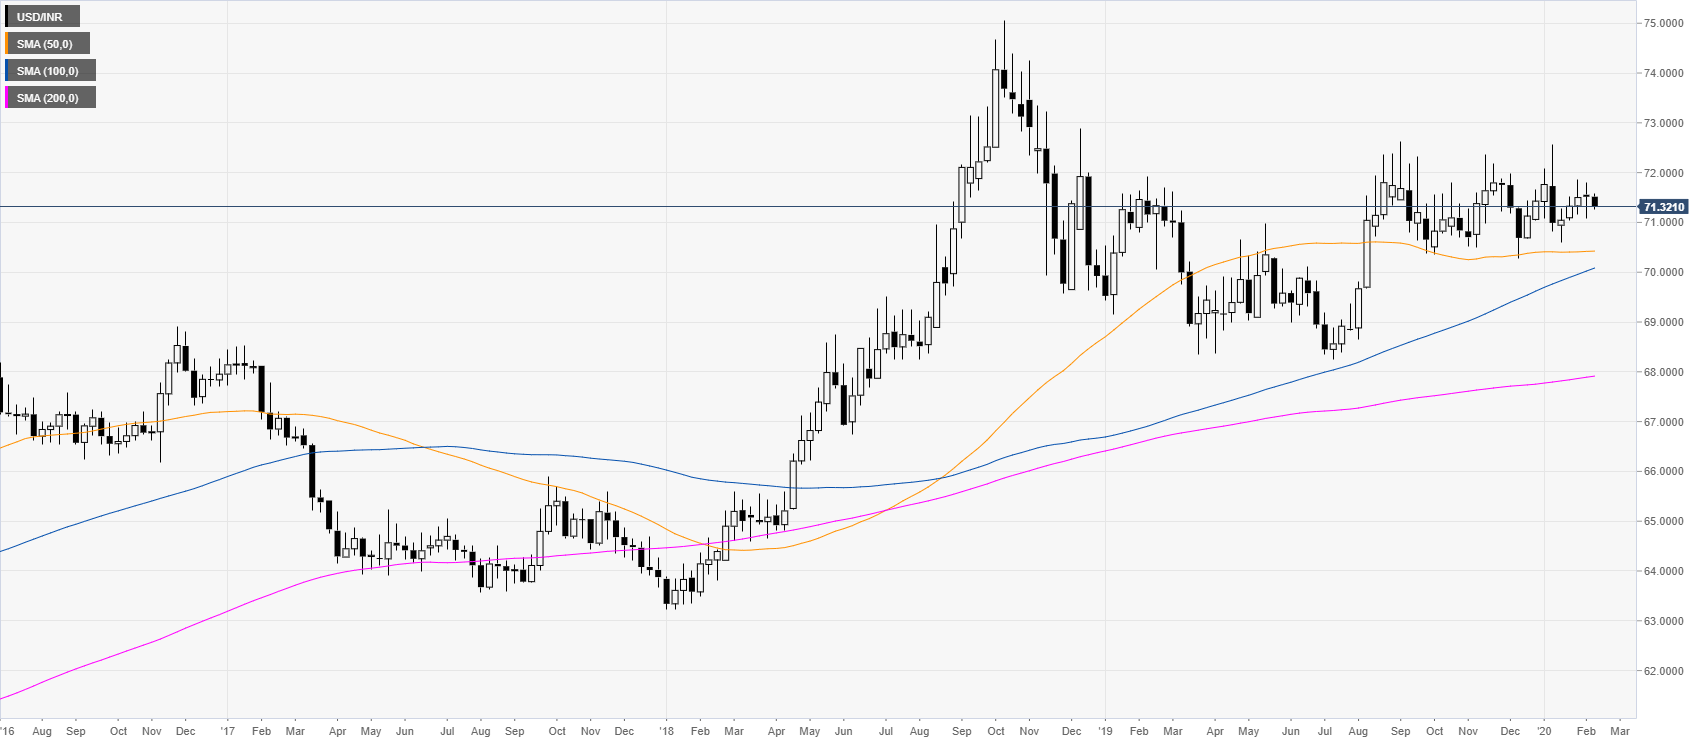
USD/INR weekly chart
Following the 2018 bull-market, USD/INR has been consolidating in a rectangle pattern while above the main weekly simple moving averages (SMAs), suggesting a bullish bias in the long term.
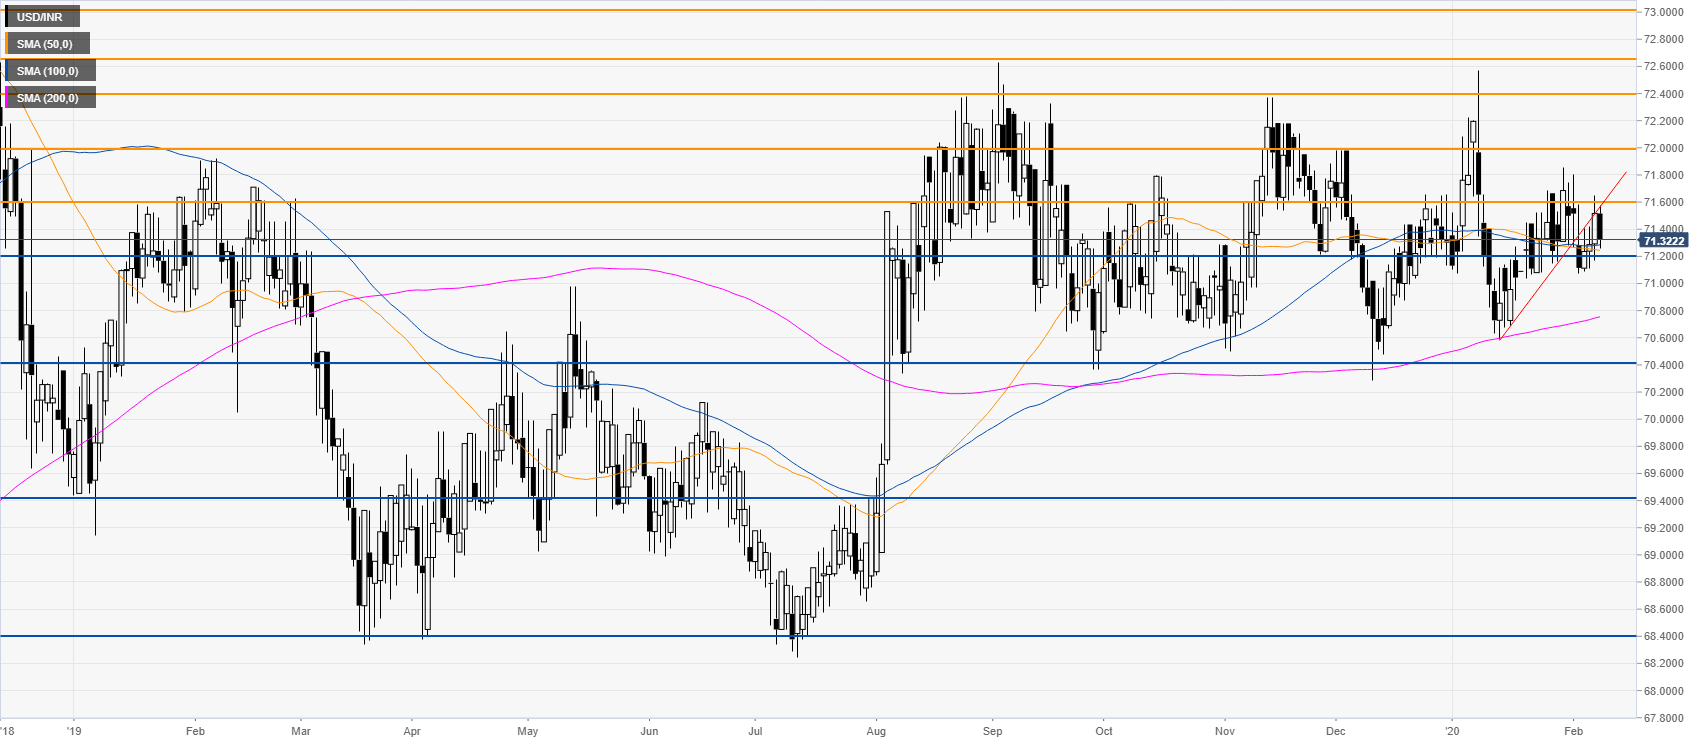
USD/INR daily chart
The spot broke below the bear flag pattern near the 71.20 support level to then retest the 71.60 resistance. The spot remains potentially vulnerable below the 72.00 figure and is at risk of declining towards the 70.40 price level. On the flip side, a daily close above the 72.00 figure can trigger bullish interest towards the 72.40 level.
Additional key levels