Back
7 Feb 2020
AUD/NZD Price Analysis: Drops following Thursday’s Doji, RBA SoMP
- AUD/NZD drops to 50-day SMA after flashing trend reversing candlestick formation the previous day.
- The yearly low holds the key to pair’s extended downpour, 100/200-day SMA limit near-term upside.
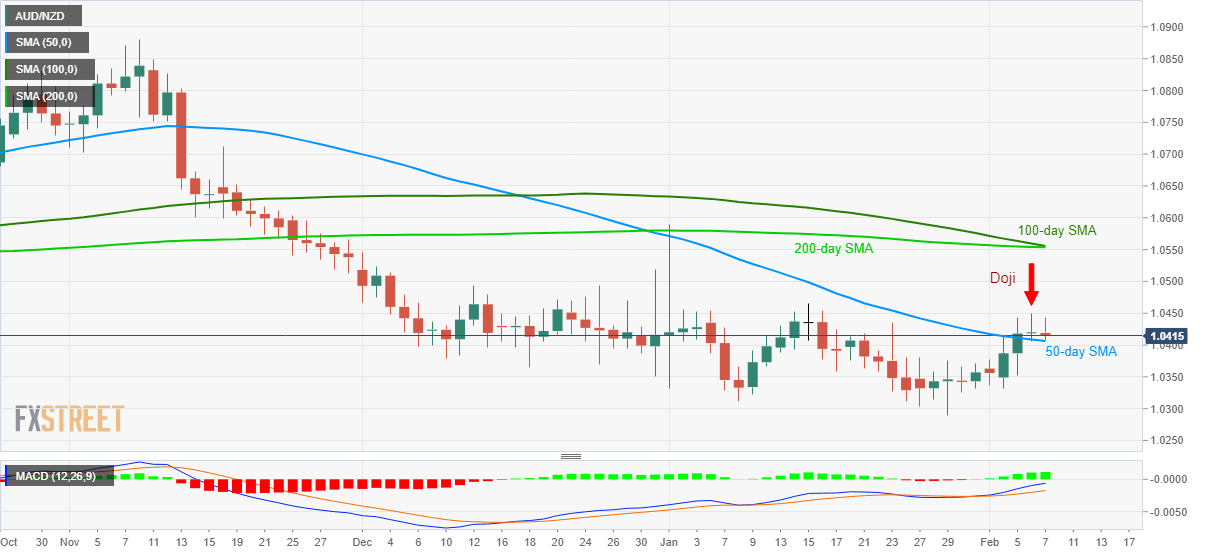
AUD/NZD declines to 1.0415 during early Friday. While RBA’s Statement of Monetary Policy (SoMP) can be cited as a fundamental factor behind the move, Thursday’s Doji clarifies the technical stand.
Read:
While a 50-day SMA level of 1.0405 offers immediate support to the pair, the weekly low near 1.0335 and 1.0300 round-figure can please sellers next.
However, the yearly bottom surrounding 1.0290 holds the key to pair’s decline towards August 2019 low near 1.0260.
On the flip side, the pair’s rise beyond Thursday’s high of 1.0450 will negate the candlestick formation and push prices upwards to 1.0500.
Though, bulls should be happy unless clearing 100/200-day SMA confluence near 1.0555/60.
AUD/NZD daily chart
Trend: Bearish