USD/CAD Technical Analysis: 50% Fibo, 200-bar SMA again challenge bulls
- USD/CAD portrays a successful U-turn from 100-bar SMA.
- Mid-October highs will be the next on bull’s radar after a sustained breakout.
- 23.6% Fibonacci retracement could please sellers.
Following its successful reversal from 100-bar SMA, USD/CAD again confronts 1.3195/3200 key resistance region during early Thursday in Asia.
Prices reversed from the said resistance confluence multiple times ever since falling beneath the same on October 17. Also increasing the odds of another pullback is the heating levels of the 14-bar Relative Strength Index.
As a result, sellers can take aim at 38.2% Fibonacci retracement level of October month declines, at 1.3160 during the quote’s another U-turn. However, a 100-bar SMA level of 1.3124 and 23.6% Fibonacci retracement around 1.3115 may question bears afterward.
In a case where the bulls keep dominating past-1.3200, October 14 high near 1.3250 and 1.3300 can offer intermediate stops to the run-up towards the previous month top of 1.3348.
USD/CAD 4-hour chart
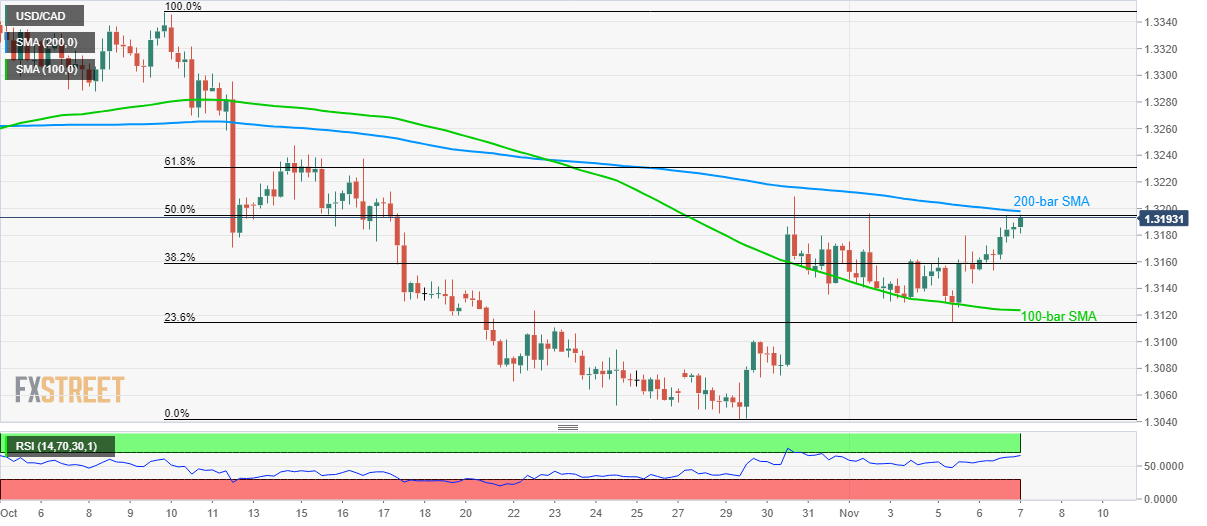
Trend: pullback expected