WTI vs. US dollar; $55 vs. 100.20
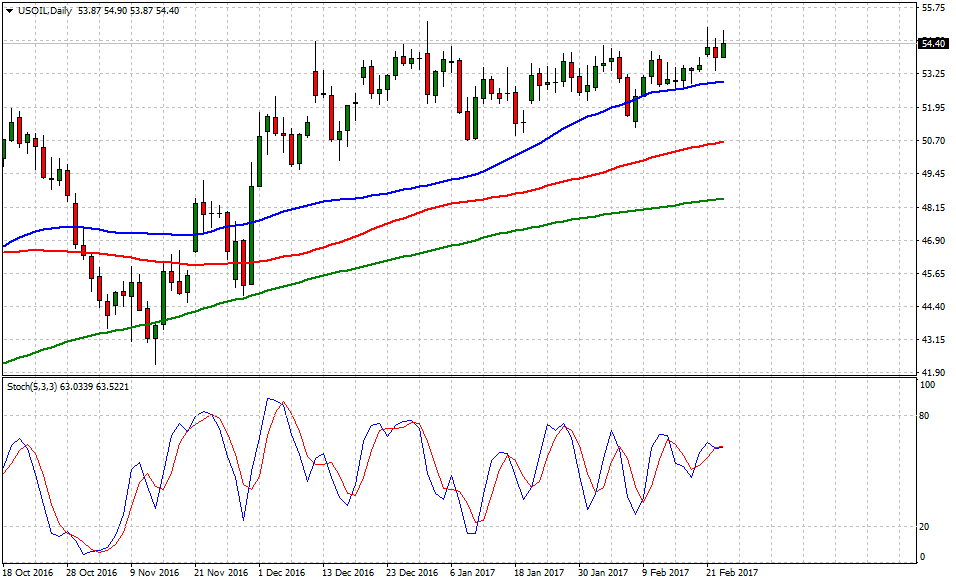
Over the last 12-consecutive trading sessions, WTI traders have enjoyed a somewhat predictable price action above the 50-DMA which allow market participants to negotiate the barrel above $50 as the expectation of higher crude prices has not been ruled out. On the other hand, the Energy Information Administration (EIA) released the latest Crude Oil Stock change that clocked 'a better than expected' figure at 0.564M against 3.475M consensus and previous 9.527M. AS of writing, WTI Crude Oil (Nymex) quoted $54.46, up +1.62% on the day or +0.86 and Brent Crude (ICE) posted on the ticker $56.58, up +1.33% on the day or +0.74.
The long-lasting question that matters the most; how long OPEC and Non-OPEC countries can keep their output curbs? There is an interesting view on targets that Edward Morse at City noted during an article published on the Financial Times, the record bet from hedge funds that expected crude prices to rebound after the 2nd 'oil crash' in the last decade makes the asset vulnerable to profit-taking. Hence, Morse sees the potential to trade oil as high as $70 a barred later in 2017.
Crude above $55.00/bbl not in OPEC's interest - Iran's Zanganeh
Technical levels to consider
In terms of technical levels, upside barriers are aligned at 55.20 (high Jan.3), and above that at 56.70 (high Jul.3.2015). Later, supports are aligned at 52.90 (50-DMA), next at 50.60 (100-DMA) and finally below that at 48.40 (200-DMA).
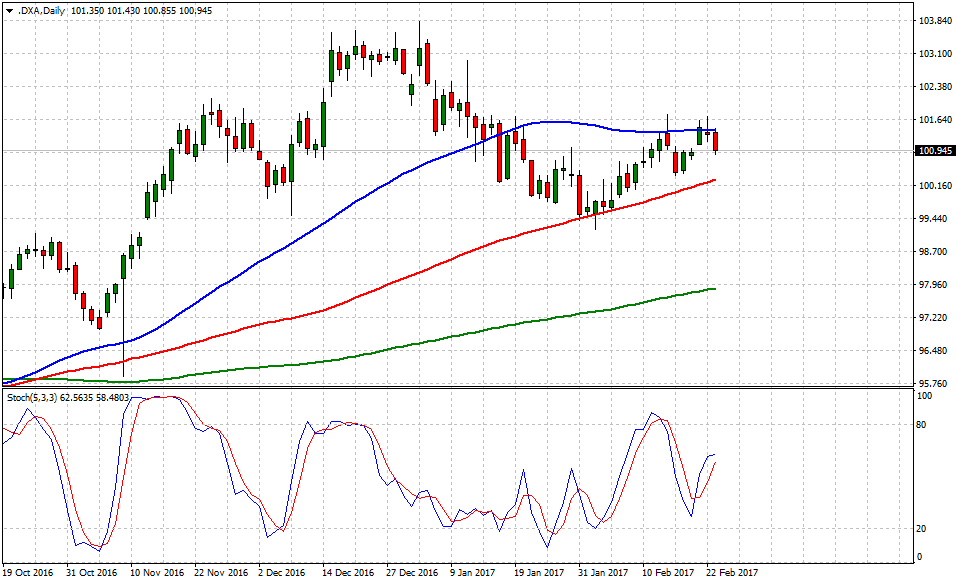
The greenback – gauged by the US Dollar Index seems muted 'at 50-DMA gates' which contributed to a sell-off across the board (this represents the 3rd attempt during the last 6 trading sessions). However, the bullish tone hasn't been diluted as long as the buck holds 100.20 handle. Now, there is technical evidence to expect either a break above 101.60 or sell-off towards the 100-DMA near 100.20.
In term of technical levels, upside barriers are aligned at 101.40 (high Feb.23), then at 102.10 (high Jan.16) and above that at 102.40 (high Jan.9). Meanwhile, supports are aligned at 100.20 (100-DMA), later at 99.60 (low Feb.6) and finally below that at 98.54 (low No.11).
US Dollar plummets to 101.00, 3-day lows