GBP/USD Price Analysis: Creeps lower, remains below 1.2700
- GBP/USD prolonged its losses for three straight days amid risk aversion.
- The pair is neutral to downward bias with momentum favoring sellers as RSI turns bearish.
- Key support levels: Last week’s low at 1.2656, 100-DMA at 1.2646, 50-DMA at 1.2612, and 200-DMA at 1.2548.
- For bullish continuation, GBP/USD must break above resistance at 1.2720/40 and test 1.2750.
The Pound Sterling extended its losses versus the Greenback on Monday, losses of some 0.06% as traders remain risk averse due to European political uncertainty. That and a Bank of England’s (BoE) monetary policy decision looming would likely keep the major consolidated. The GBP/USD trades at 1.2675 after hitting a daily high of 1.2688.
GBP/USD Price Analysis: Technical outlook
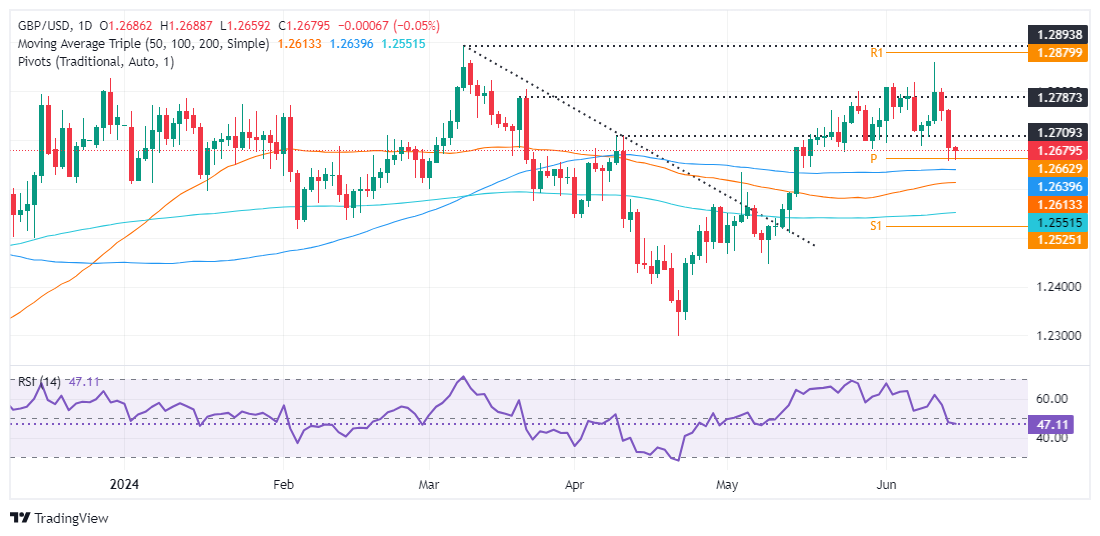
From a technical standpoint, the GBP/USD is neutral to downward biased, even though price action is above the daily moving averages (DMAs). Momentum shifted in favor of sellers, which according to the Relative Strength Index (RSI) are gathering traction as it turns bearish.
Once the GBP/USD dived below 1.2700 on further weakness, opened the door for additional losses. The next support would be last week’s low of 1.2656, followed by the 100-DMA at 1.2646, ahead of the 50-DMA at 1.2612. A breach of the latter will expose the 200-DMA at 1.2548.
Conversely, if traders want a bullish continuation, they must lift the GBP/USD above a broken support trendline that turned resistance at around 1.2720/40 before testing 1.2750.
GBP/USD Price Action – Daily Chart
British Pound PRICE Today
The table below shows the percentage change of British Pound (GBP) against listed major currencies today. British Pound was the strongest against the Japanese Yen.
| USD | EUR | GBP | JPY | CAD | AUD | NZD | CHF | |
|---|---|---|---|---|---|---|---|---|
| USD | -0.13% | 0.06% | 0.32% | 0.10% | 0.32% | 0.31% | 0.16% | |
| EUR | 0.13% | 0.21% | 0.49% | 0.24% | 0.36% | 0.49% | 0.29% | |
| GBP | -0.06% | -0.21% | 0.36% | 0.03% | 0.14% | 0.25% | 0.11% | |
| JPY | -0.32% | -0.49% | -0.36% | -0.11% | 0.00% | 0.13% | -0.10% | |
| CAD | -0.10% | -0.24% | -0.03% | 0.11% | 0.15% | 0.20% | 0.07% | |
| AUD | -0.32% | -0.36% | -0.14% | -0.01% | -0.15% | 0.19% | -0.02% | |
| NZD | -0.31% | -0.49% | -0.25% | -0.13% | -0.20% | -0.19% | -0.14% | |
| CHF | -0.16% | -0.29% | -0.11% | 0.10% | -0.07% | 0.02% | 0.14% |
The heat map shows percentage changes of major currencies against each other. The base currency is picked from the left column, while the quote currency is picked from the top row. For example, if you pick the British Pound from the left column and move along the horizontal line to the US Dollar, the percentage change displayed in the box will represent GBP (base)/USD (quote).