Gold Price Forecast: XAU/USD climbs above $1,950 as investors anticipate only one interest rate hike by Fed
- Gold price has jumped above the $1,950.00 resistance as the USD Index is struggling in extending its recovery.
- Investors’ risk-taking ability has dropped and the appeal for risk-perceived assets has softened.
- Gold price is marching towards the upper portion of the Falling Wedge pattern.
Gold price (XAU/USD) witnessed decent buying interest around $1,947.50 in the London session. The precious metal has climbed above the crucial resistance of $1,950.00 as investors are anticipating only one more interest rate hike from the Federal Reserve (Fed) this year.
S&P500 futures have extended their downside journey as investors have the excuse of an extended weekend in the United States due to Juneteenth. Investors’ risk-taking ability has dropped and the appeal for risk-perceived assets has softened.
Economists at HSBC believe that investors should prepare for some consolidation as valuations have risen, and the potential of further Fed tightening may cut into future earnings estimates and valuations in the short term. However, we feel the Fed is closer to the end of its monetary policy tightening cycle, and this should bode well for US equities.
The US Dollar Index (DXY) has turned sideways as the upside is restricted around 102.60 despite Fed chair Jerome Powell having confirmed that no rate cuts are appropriate this year. In spite of rising weekly jobless claims three times in a row, a jump in the Unemployment Rate to 3.8%, and softening of consumer and producer inflationary pressures due to lower gasoline prices, the Fed believes that core inflation is still persistent and labor market conditions have not softened enough to announce victory over the sticky Consumer Price Index (CPI).
Gold technical analysis
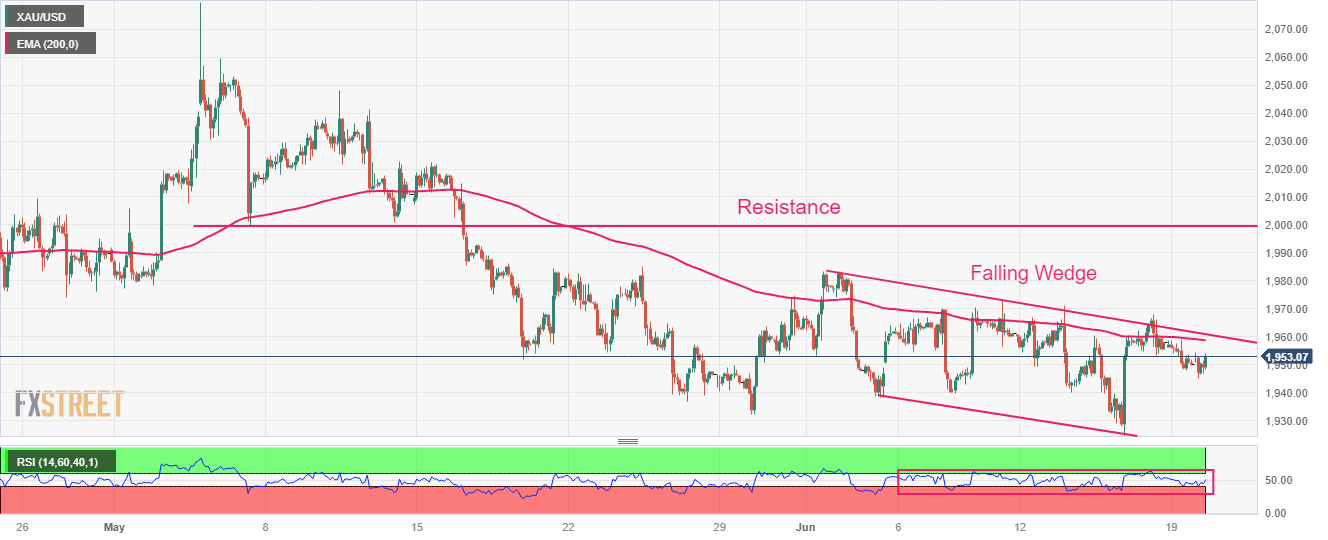
Gold price is marching toward the upper portion of the Falling Wedge chart pattern, which indicates a consistent downside move followed by an upside breakout. The 200-period Exponential Moving Average (EMA) at $1,958.84 is acting as a barricade for the Gold bulls. Horizontal resistance is plotted from May 05 low around $2,000.00.
The Relative Strength Index (RSI) (14) is oscillating in the 40.00-60.00 range, which indicates a non-directional performance.
Gold two-hour chart