USD/MXN Price Analysis: Bears await break below descending channel support near 17.00
- USD/MXN kicks off the new week on a positive note and moves away from a multi-year low.
- The RSI on the daily chart flashes oversold conditions on the daily chart and lends support.
- The formation of a descending channel points to a well-established short-term bearish trend.
The USD/MXN pair edges higher during the Asian session on Monday, albeit lacks bullish conviction and remains well within the striking distance of its lowest level since December 2015. The pair currently trades around the 17.0915-17.0920 region, up just over 0.10% for the day, and so far, has managed to defend support marked by the lower boundary of a nearly one-month-old descending channel.
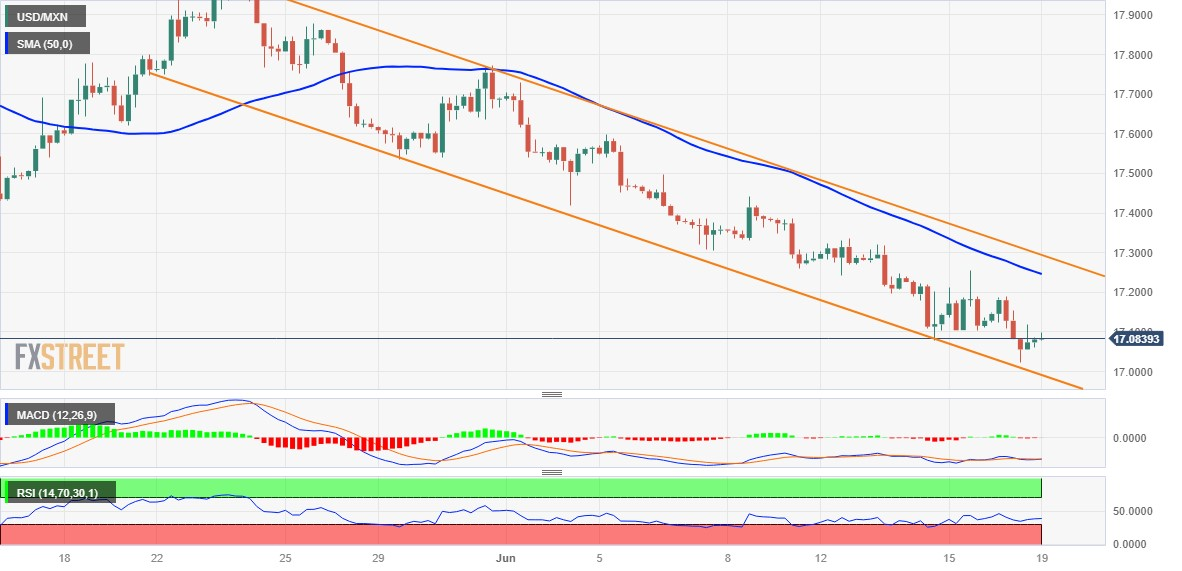
From a technical perspective, the Relative Strength Index (RSI) on the daily chart is flashing oversold conditions and holding back traders from placing fresh bearish bets around the USD/MXN pair. That said, the lack of any meaningful buying suggests that a multi-month-old downtrend is still far from being over. Hence, any attempted recovery move could attract fresh sellers near the 17.2550 area, which coincides with the 50-period Simple Moving Average (SMA) on the 4-hour chart.
This, in turn, should cap the USD/MXN pair near the trend-channel resistance, currently pegged around the 17.2600 round-figure mark, which should now act as a pivotal point for short-term traders. A convincing break through the said barrier will suggest that the USD/MXN pair has formed a near-term bottom and pave the way for a further appreciating move towards last week's swing high, around the 17.3345 area.
On the flip side, the multi-year low, around the 17.0245-17.0240 area touched on Friday, now seems to protect the immediate downside ahead of the trend-channel support, currently around the 17.0000 psychological mark. A convincing break below the latter will mark a fresh bearish breakdown and set the stage for an extension of the recent well-established bearish trend witnessed over the past three months or so.
USD/MXN 4-hour chart
Key levels to watch