GBP/JPY Price Analysis: Snaps six days of gains, drops below 168.00
- GBP/JPY hit a two-week high but trimmed some gains, back below 168.00.
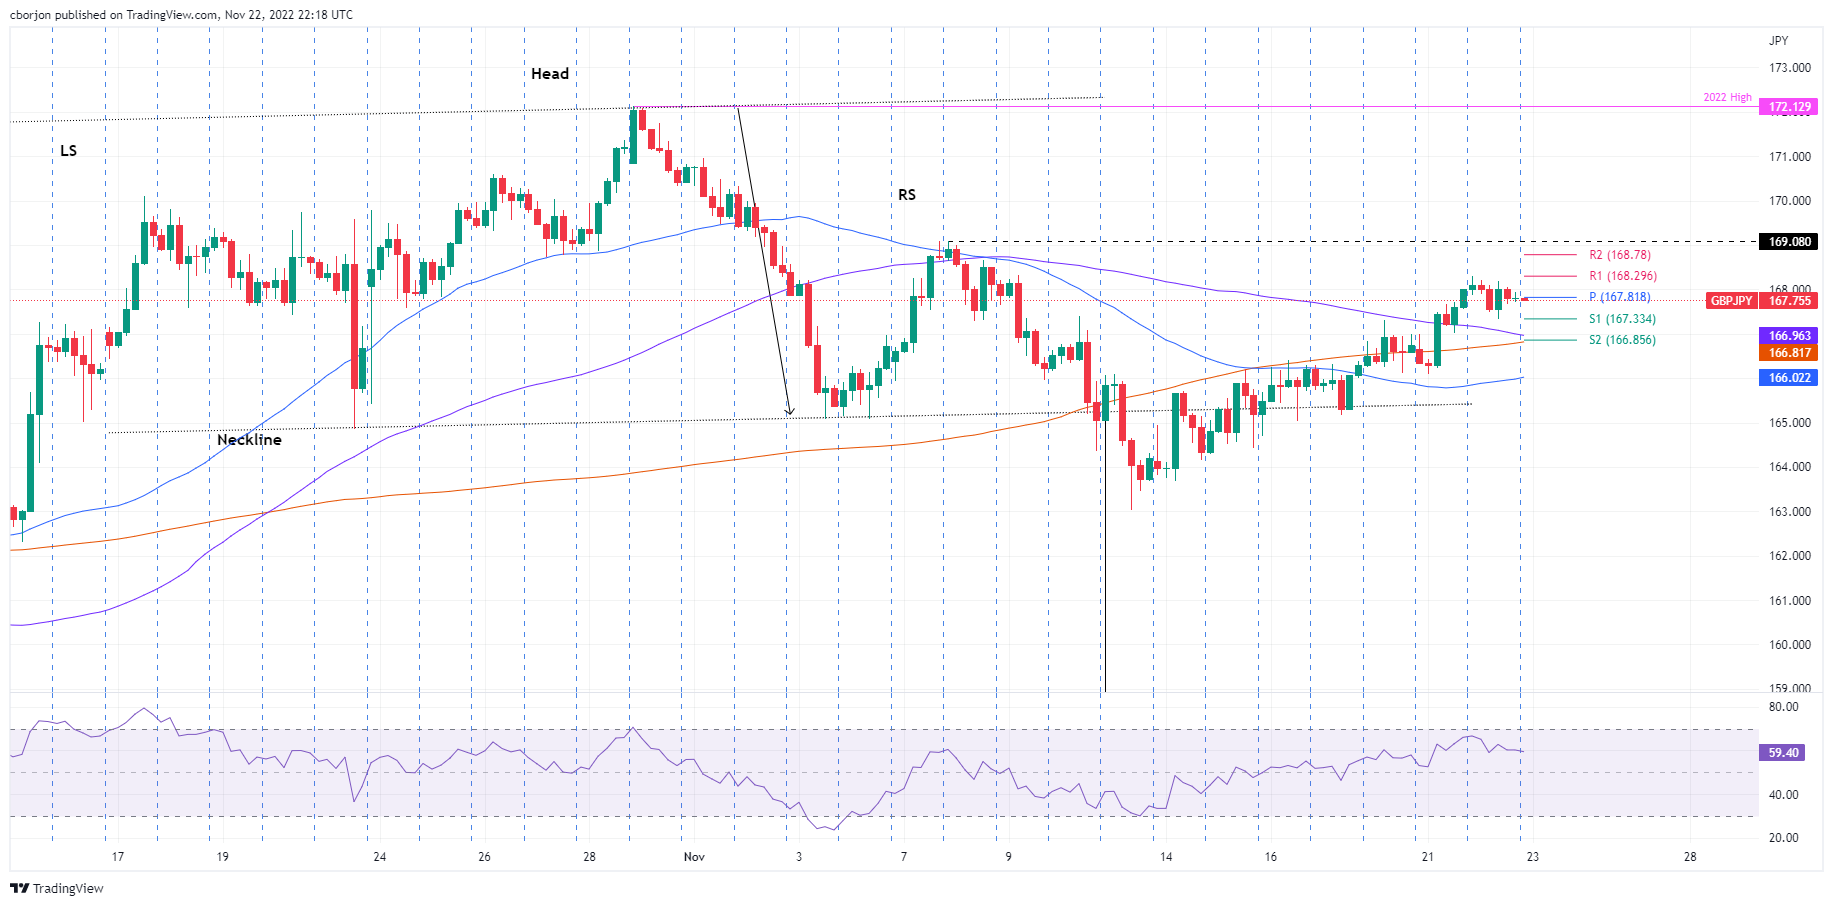
- The daily chart suggests the GBP/JPY is neutral-upward biased, but a head-and-shoulders pattern remains in play.
- GBP/JPY Price Analysis: Failure to crack 168.00 exacerbated a fall toward 167.50.
On Tuesday, the GBP/JPY retraces after hitting a two-week high around 168.30, amid upbeat sentiment, as shown by Wall Street, registering gains between 1.18% and 1.36%. However, the head-and-shoulders chart pattern remains in play as long as the right shoulder, around 169.08, is not surpassed. That said, the GBP/JPY is trading at 167.75, below its opening price by 0.46%.
GBP/JPY Price Analysis: Technical outlook
In the long term, the GBP/JPY remains neutral to upward biased, though a head-and-shoulders pattern emerging in the daily chart opened the door for a fall to 158.40. However, during the last week, the cross-registered gains of 2%, exchanging hands 300 pips above the neckline. If British Pound (GBP) buyers reclaim 169.00, that would invalidate the pattern and might exacerbate a rally toward the YTD highs of 172.13.
Short term, the GBP/JPY 4-hour chart illustrates the pair as neutral, slightly upward biased. GBP/JPY price action registered successive series of higher highs/lows, advancing steadily from around 163.03. On its way north, the GBP/JPY hurdled the 50, 200, and 100-Exponential Moving Averages (EMAs), suggesting buyers gathered momentum. But the Relative Strength Index (RSI), aiming downwards, could open the door for a pullback.
Therefore, the GBP/JPY first support would be the S1 daily pivot point at 167.33. Break below will expose the confluence of the 100 and the 200-EMAs around 166.81/93, followed by the 50-EMA at 166.02. Otherwise, the GBP/JPY key resistance levels lie at the R1 daily pivot at 168.29, followed b the R2 pivot level at 168.78, followed by the November 7 daily high at 169.00.
GBP/JPY Key Technical Levels